
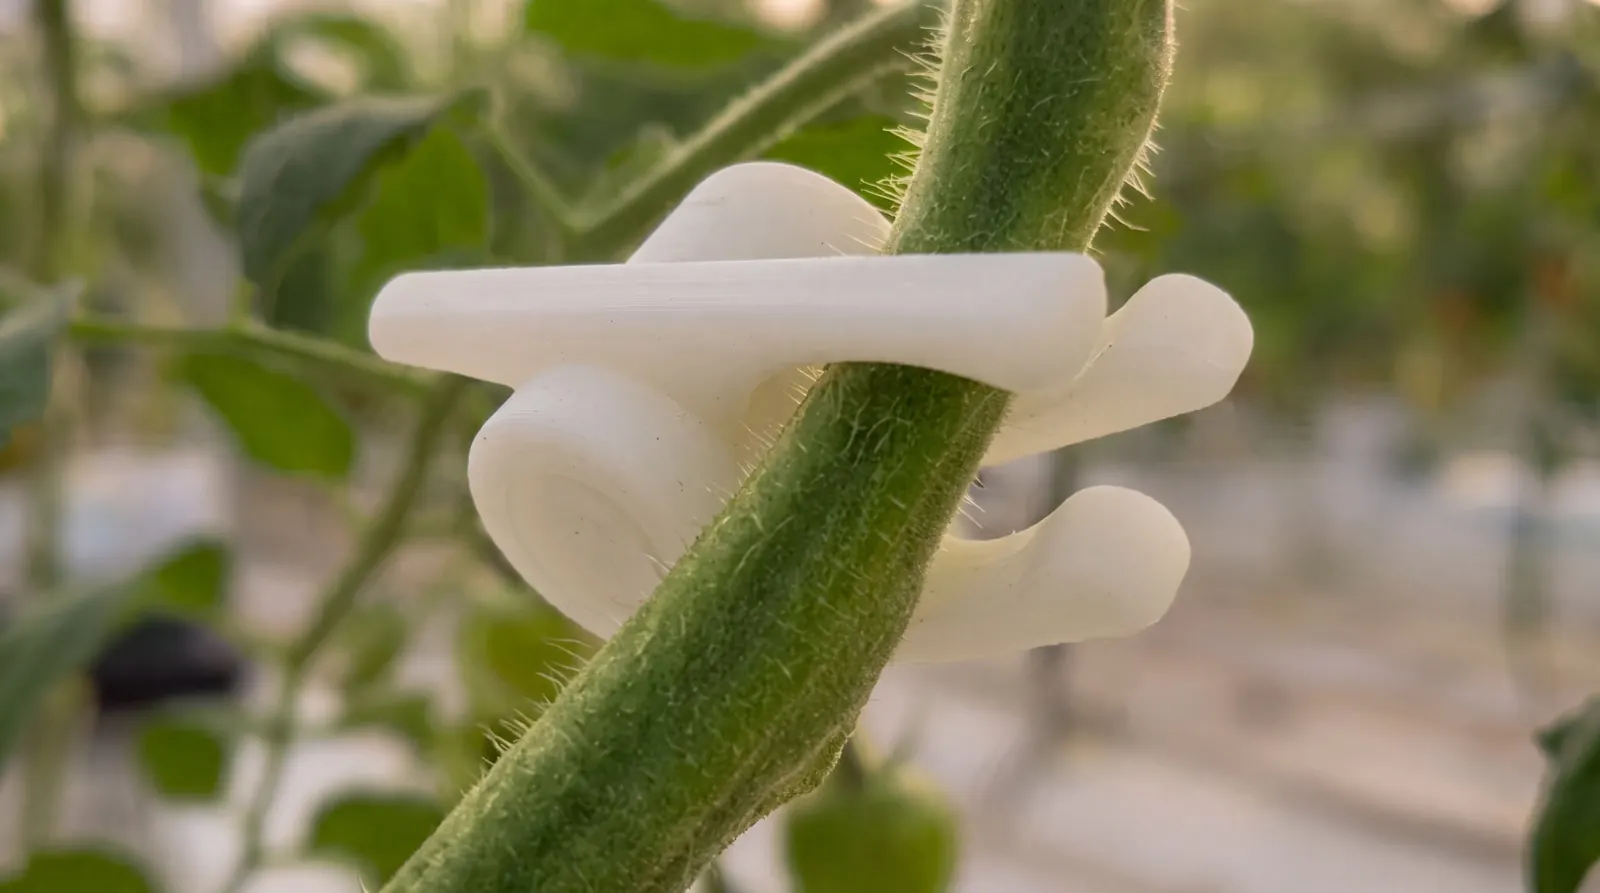
Your plants are talking. Every day, in micrometres.
A plant stem is not a rigid pipe. It shrinks and swells continuously. It also grows faster or slower depending on where the plant puts its energy: a heavy fruit load draws on the same sugars that would otherwise thicken the stem. That makes the stem a reflection of the plant’s balance in its environment, from light, climate, irrigation and EC to the fruit it carries.
Most of what we measure in a greenhouse describes the conditions. The stem describes the result: how the plant is actually coping with those conditions, right now. Here’s what that signal is, what it tells you, and how we use it at Sensie to support the decisions you make today.
A day in the life of a stem
Follow one plant stem through a sunny day and you see the plant at work.
- Before sunrise the stem is at its thickest. Overnight the roots have refilled the tissue, and the plant starts the day fully charged.
- Once light hits the leaves, they start transpiring. Water leaves the plant faster than the roots can deliver it, so the plant borrows the difference from water stored in its stem. The stem shrinks.
- In the early afternoon the stem reaches its thinnest point. Demand peaks and the plant is working hardest.
- In the late afternoon and evening demand drops. The roots catch up, the tissue refills and the stem swells back.
- The next morning, compare with the morning before. Whatever is left over is growth.
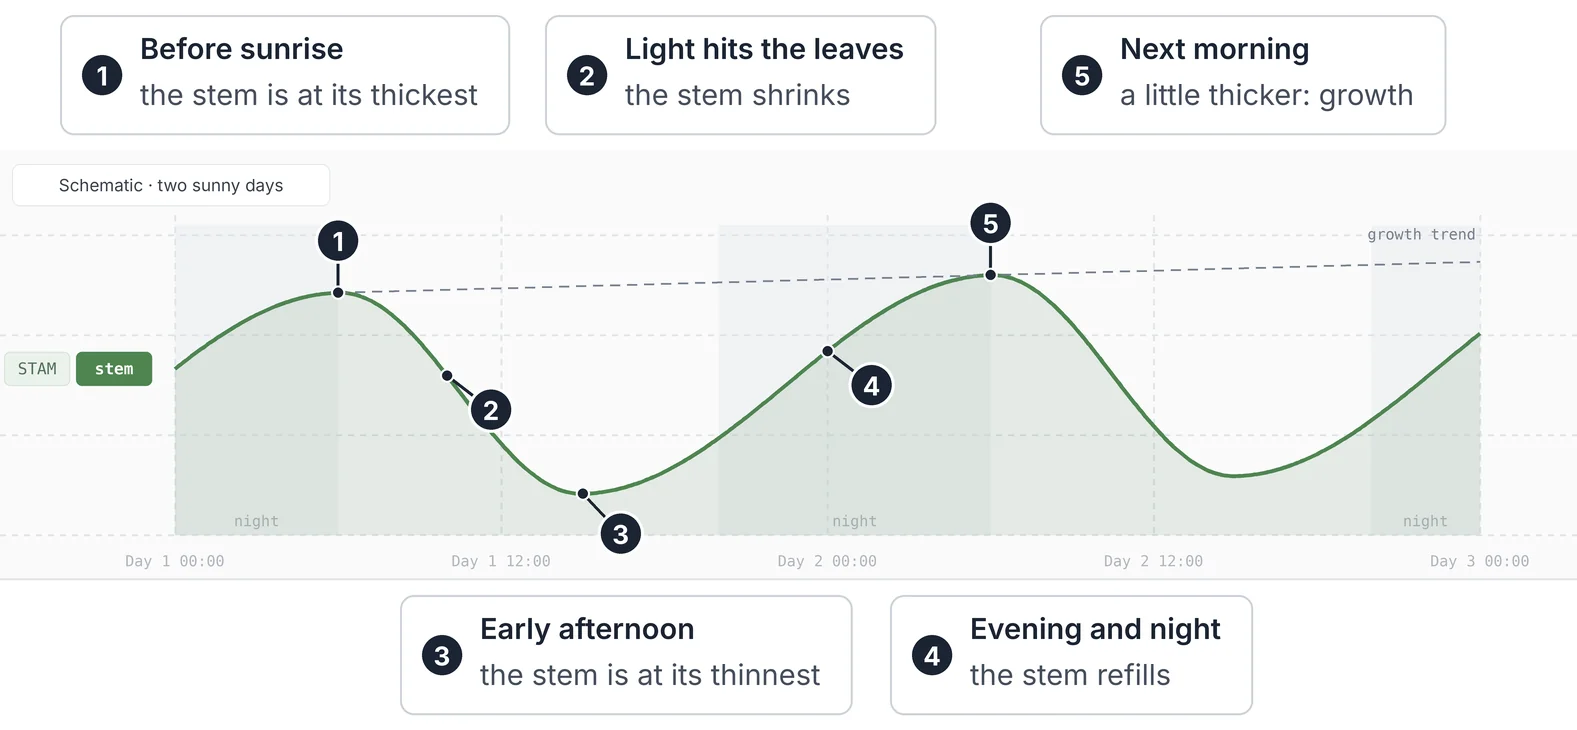
Two signals ride on top of each other: a daily swing that reflects the water balance, and a slow upward trend that reflects growth. Read together, they tell you how hard the plant worked today and whether it had enough left to grow.
Under assimilation lighting, the plant’s day starts when the lamps go on, not when the sun comes up. The stem shows that too.
How Sensie listens
At Sensie we measure stem diameter 24/7, every 2.5 minutes. Measuring around the clock shows the moment shrinkage starts in the morning, the depth of the afternoon dip and, just as important, how the plant recovers in the dark, when nobody is in the greenhouse to look.
- Water content
- EC
- Substrate temperature
- Stem diameter
- every 2.5 minutes
- day and night
- Temperature
- Humidity (VPD)
- Light (PPFD)
The stem never stands alone. Each sensor is read together with the two sides that drive it: supply from the root zone and demand from the climate. Supply and demand are the levers a grower can adjust. The stem shows how the balance between them is expressed in the plant.
Here’s a real day in the Sensie dashboard, with the plant, the root zone and the climate on one screen.
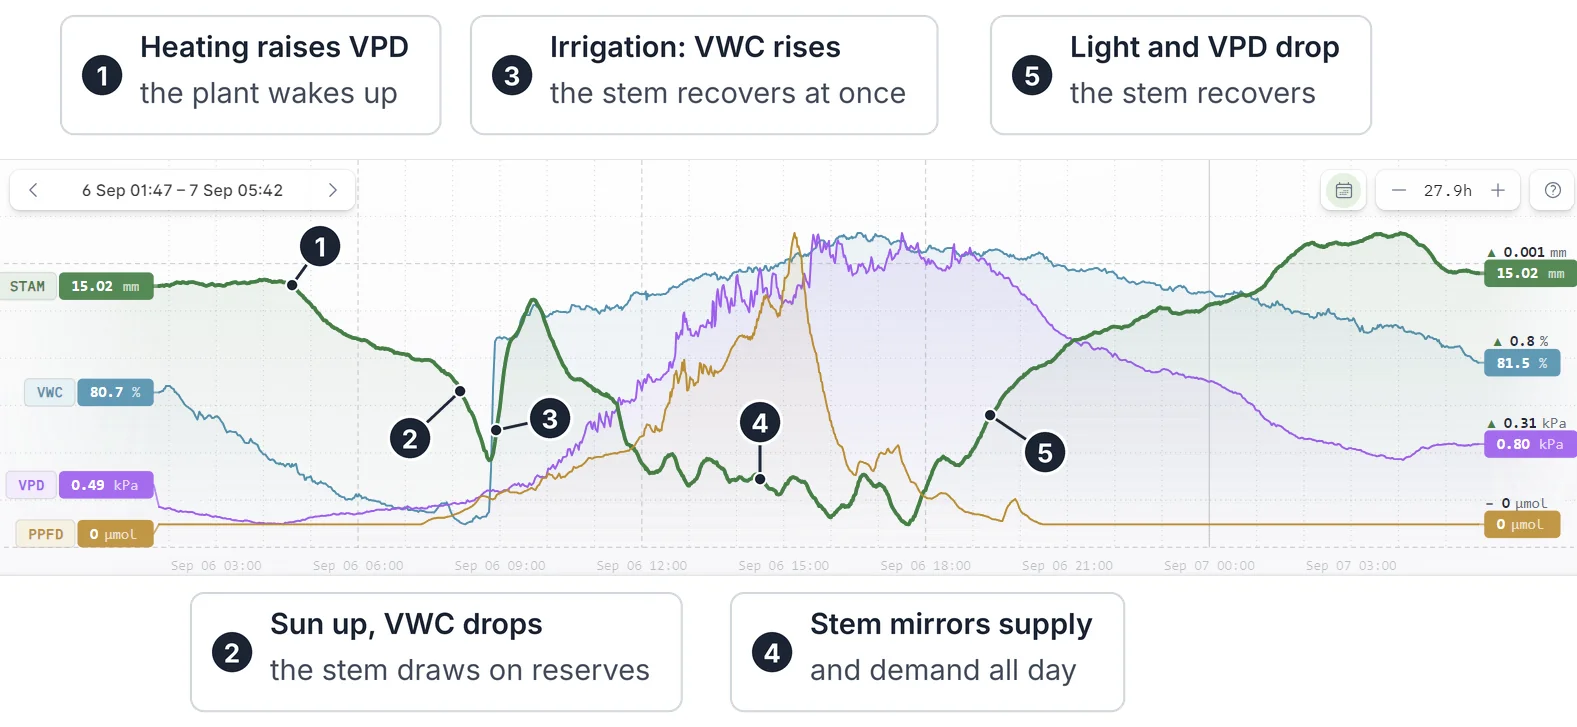
- Early morning: heating raises VPD and the plant becomes active. The stem starts to shrink before the sun is up.
- Sun up: transpiration speeds up. Water content drops and uptake gets harder, so the plant draws on its own reserves and the stem shrinks faster.
- First irrigation: as soon as water is given, water content jumps and the stem recovers.
- Through the day: the stem settles into a mirror pattern with supply and demand.
- Evening: light levels drop. As soon as VPD drops too, the plant can recover, and by night the stem is back at its morning diameter.
What the stem reveals
Followed that closely, a stem reveals far more than its thickness. Six things we look for.
01The rhythm matters more than the thickness
Many growers already measure stem or head thickness by hand once a week. That gives the slow trend: is the plant getting more vegetative or more generative and does it become weaker or stronger? It can’t tell you how hard the plant is working today.
Measuring continuously shows the daily swing and, above all, whether the plant fully recovered overnight. When the stem is thinner in the morning than the morning before, the plant starts the day with a deficit. A night or two of incomplete recovery is often the first sign that something is off, well before it shows in the crop.
02The stem mirrors VPD
Put stem diameter and VPD on one graph and they move as mirror images. When the air gets warmer and drier, VPD rises, the plant transpires harder and the stem shrinks. When VPD drops, in the evening or under a closed screen, the stem swells back.
That mirror is the plant answering demand in real time. As long as the mirror holds, supply keeps pace with demand.
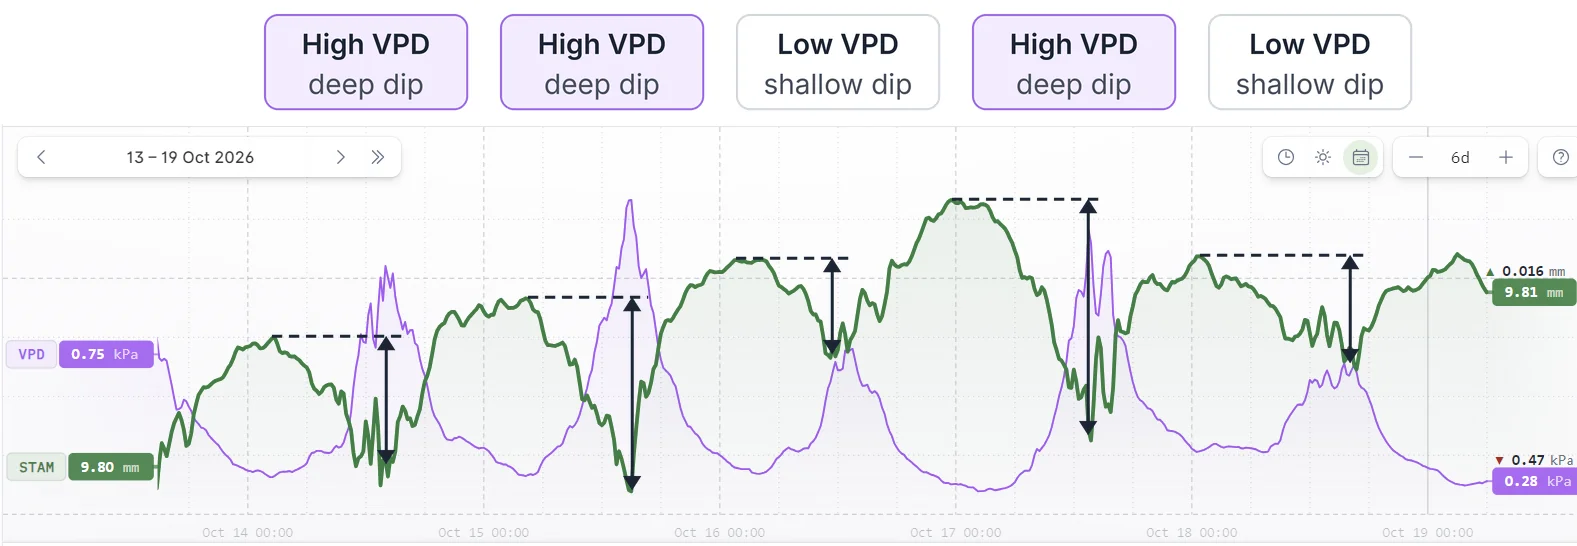
03Read the dip against the day the plant had
A deep afternoon dip is not a problem in itself. On a bright day with dry air (high VPD), the plant transpires hard and the stem should shrink more. If it refills at night and keeps growing, that is a plant doing exactly what you want.
The warning sign is a dip out of proportion to the demand. Two examples:
- A dull, humid day with the same dip as yesterday’s sunny one. Demand doesn’t explain it, so the cause sits on the supply side: the slab, the EC or the roots.
- A stem that keeps shrinking well after the light drops, instead of starting to refill. Demand is easing, yet the plant still can’t keep up.
The opposite tells you something too. A nearly flat curve on a grey, humid day means the plant is hardly transpiring. That is low stress, but also low activity: water flow carries calcium, so less of it reaches the youngest leaves at the growing tip.
04Irrigation becomes visible when the margin shrinks
When supply and demand are in equilibrium, the morning irrigations barely show on the stem. The plant has enough buffer, so one more irrigation changes little.
As the substrate dries out over several days, that changes. Water content drops, pore EC rises as the salts concentrate in less water, and the stem starts reacting more strongly to every irrigation: water content goes up and the diameter follows. In the graph below, that response grows towards the end of the period.
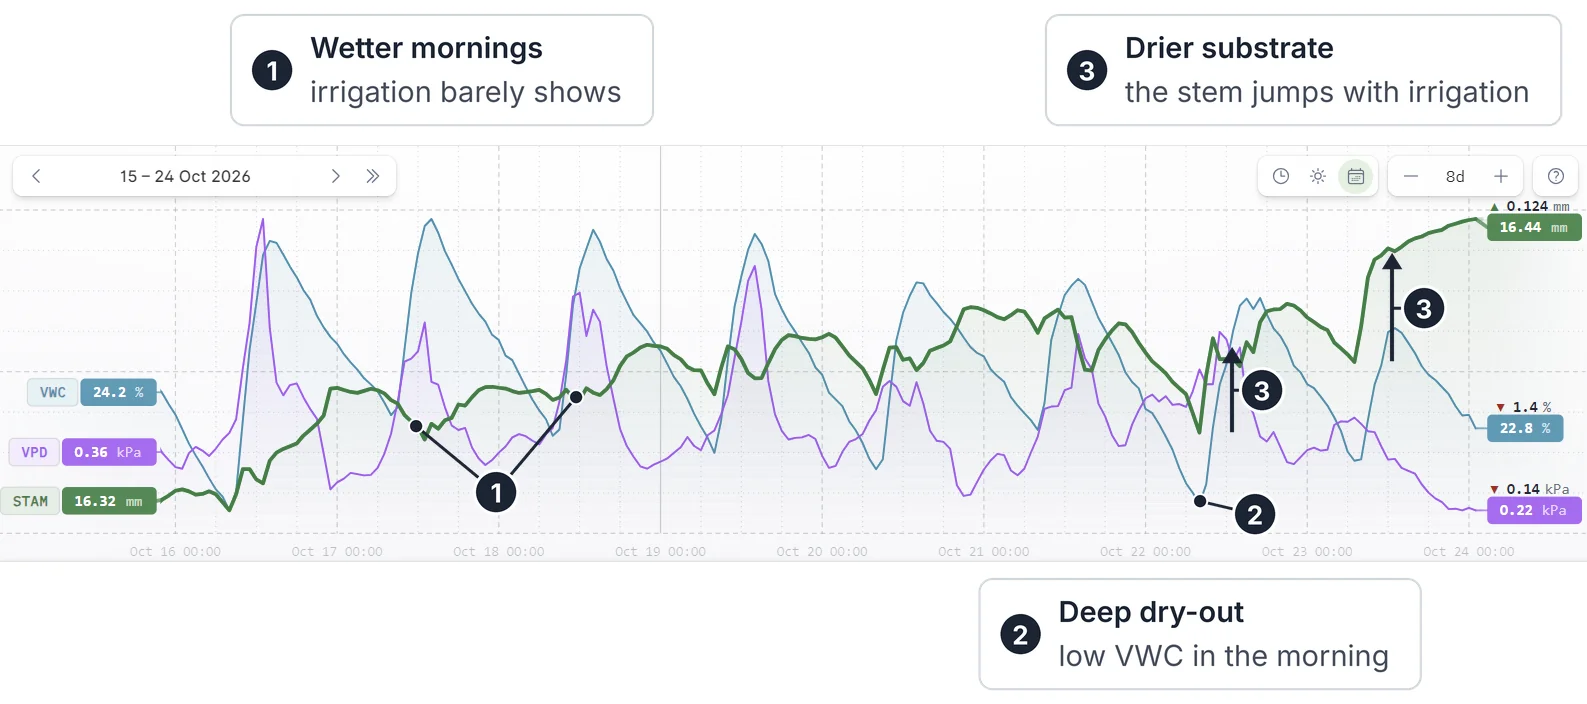
A stem that jumps after each irrigation is telling you it now depends on the next one. That is the moment to decide: is this the generative push you wanted, or is the margin getting too thin?
05The root zone tells you which lever to pull
When the stem says the plant is short of water, the next question is why. Four causes look alike on the stem, but each needs a different response.
| Cause | What the root zone shows | Lever |
|---|---|---|
| Too little water | Water content falls through the day; the stem recovers after each irrigation | Start irrigating earlier or irrigate more often |
| Too much salt | Water content is fine but pore EC is rising; extra irrigations help less than expected | Lower the EC of the irrigation water or raise the drain |
| Too much water | Water content stays high and EC is fine, yet the plant acts thirsty: roots short of oxygen | Give less and let the slab dry back |
| Cold roots | Substrate temperature is low; the dip is worst early in the morning | Fix the root-zone temperature before adding water |
Same signal, four different levers, and in two of them more water makes things worse, not better. That is why we never read the stem without the root zone next to it.
06Stress is a tool, not a goal
Growers use stress deliberately. A little extra stress, through a drier slab or a higher EC, steers the plant towards fruit (generative) and can pay off in the short term in fruit set or flavour.
Push too hard or too long, though, and you pay for it later in vigour and yield. Growing is a marathon, not a sprint. The diameter trend shows whether the plant still has the vitality to go the distance: a stem that keeps growing can carry its load, while a stem whose growth stalls for days is spending more than it earns.
From curves to decisions
Growers don’t have time to study detailed graphs, and they shouldn’t have to. What they need is a plain answer to two questions: where is the stress coming from, and what can I do about it?
That is how we use the data. We relate growth to supply and demand, because the balance between the two is expressed in the plant. If the plant is fine, we’re happy. If it isn’t, we pinpoint the main cause, based on the most recent data.
That supports the decisions you make today. Not looking back at mistakes and philosophising about what would have been better.
It works the other way round too. Every action in the greenhouse changes something, and every change reaches the plant. Closing a screen, opening the vents, an irrigation, a crop spray, a round of plant work: each one shows up on the stem.
So you can verify the impact of what you do on the plant itself, instead of relying on proxies such as air temperature or drain readings. We’ll go deeper into these effects in our next post.
The plant is the sensor.
We translate.
 Written byMaxime DedeckerCrop Intelligence Advisor at Sensie